Built for delivery leaders and the teams behind them.
01 / The real thing
From portfolio signal to the issue behind it.
These are the views the templates are built around: portfolio health, project drivers, and the issue flow underneath. The screenshots use an early dataset; the story gets much richer as Jira history accumulates.
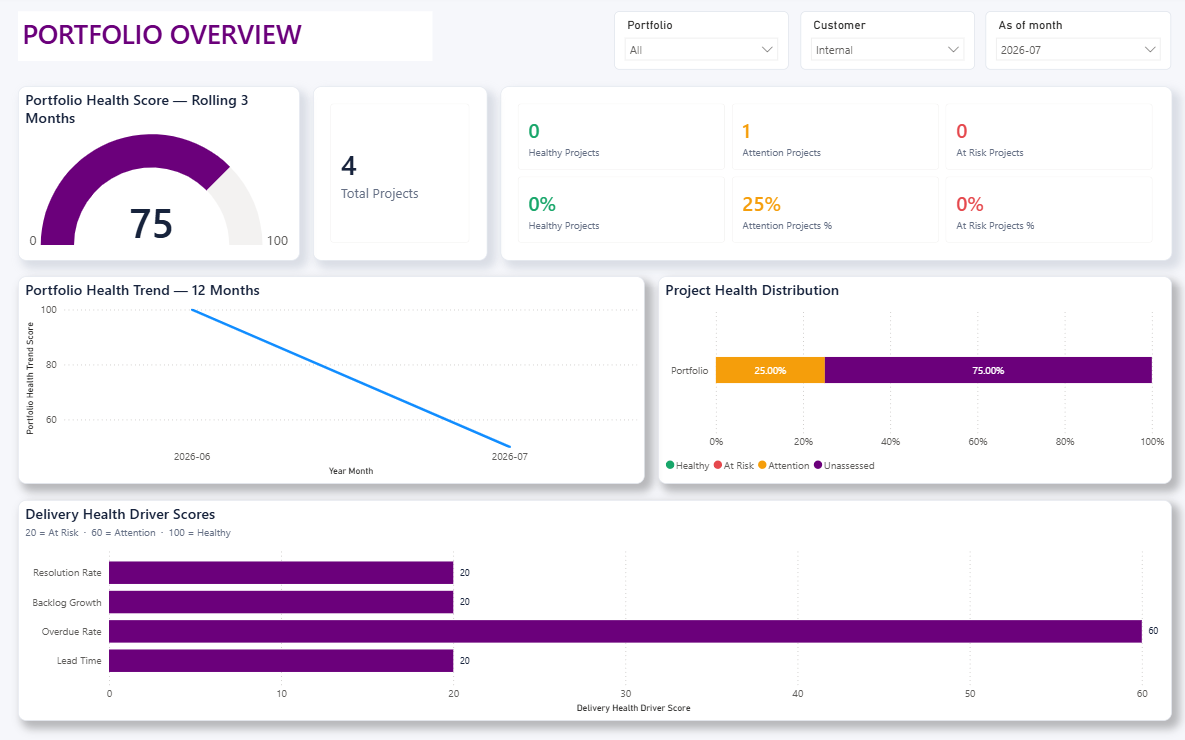
01 / Portfolio overview
See the whole portfolio without losing the signal.
Organize projects into meaningful portfolios—such as Delivery, Discovery, and Training—and see how each area is performing. Bring health, trends, risk, and delivery drivers into one clear view, so you quickly know where attention is needed.
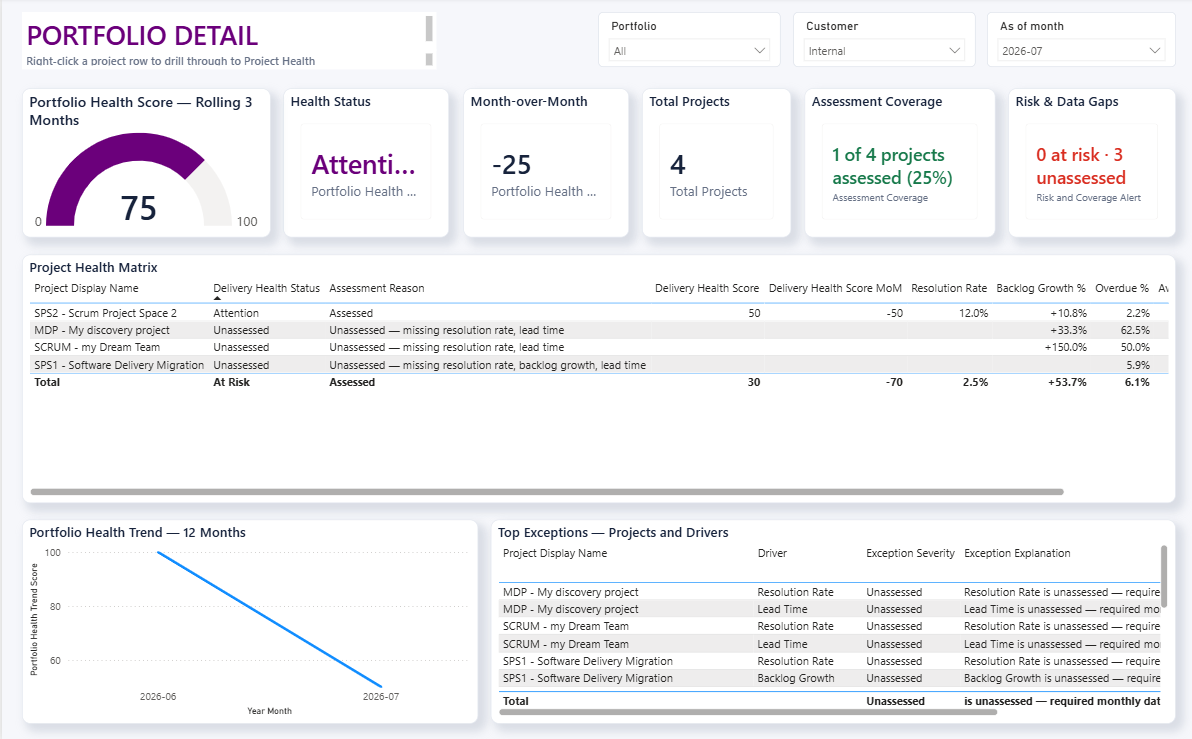
02 / Portfolio detail
Know which projects need the conversation.
Explore delivery by customer—such as Internal, GreenGrid Energy, Harborline Logistics, and others. Compare project health, assessment coverage, movement over time, and the exceptions driving each result. Your next customer or portfolio review starts with evidence.
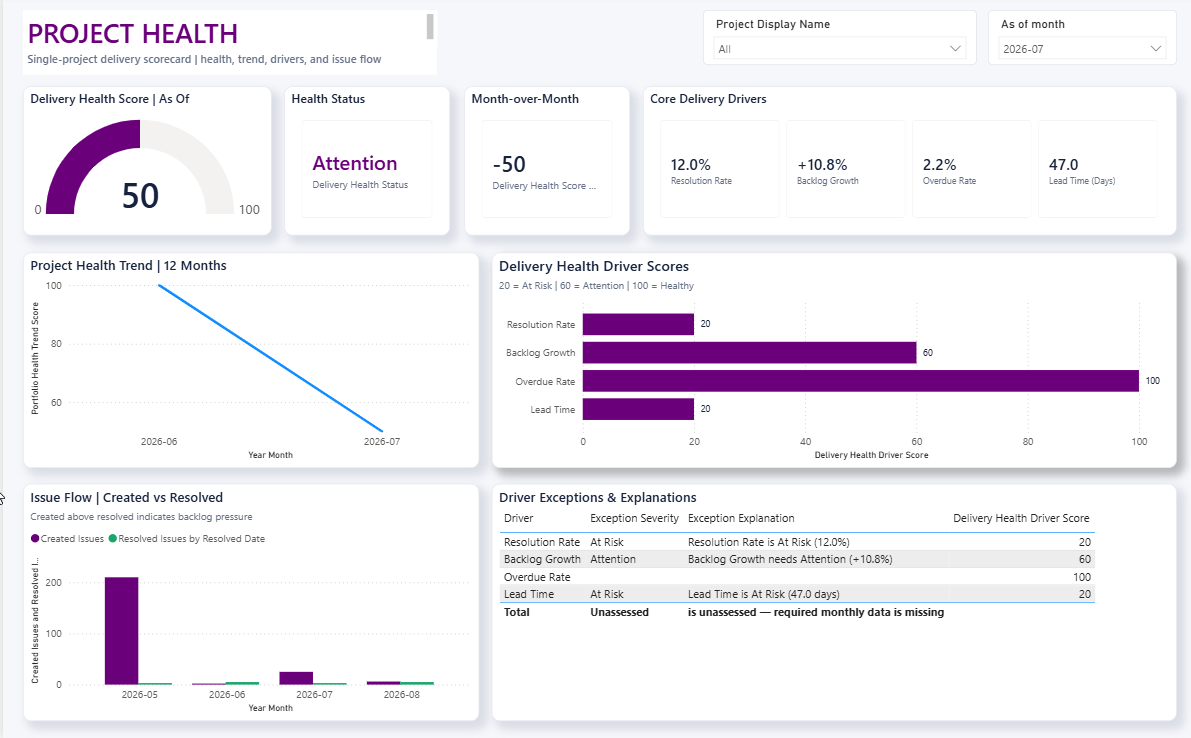
03 / Project health
Understand the score. Then understand why.
Choose an As of month to see the project exactly as it stood at that point in time onwards—not only where it stands today.
Driver Exceptions & Explanations turns the score into plain-language signals: what is healthy, what needs attention, what is at risk, and the numbers behind each result.
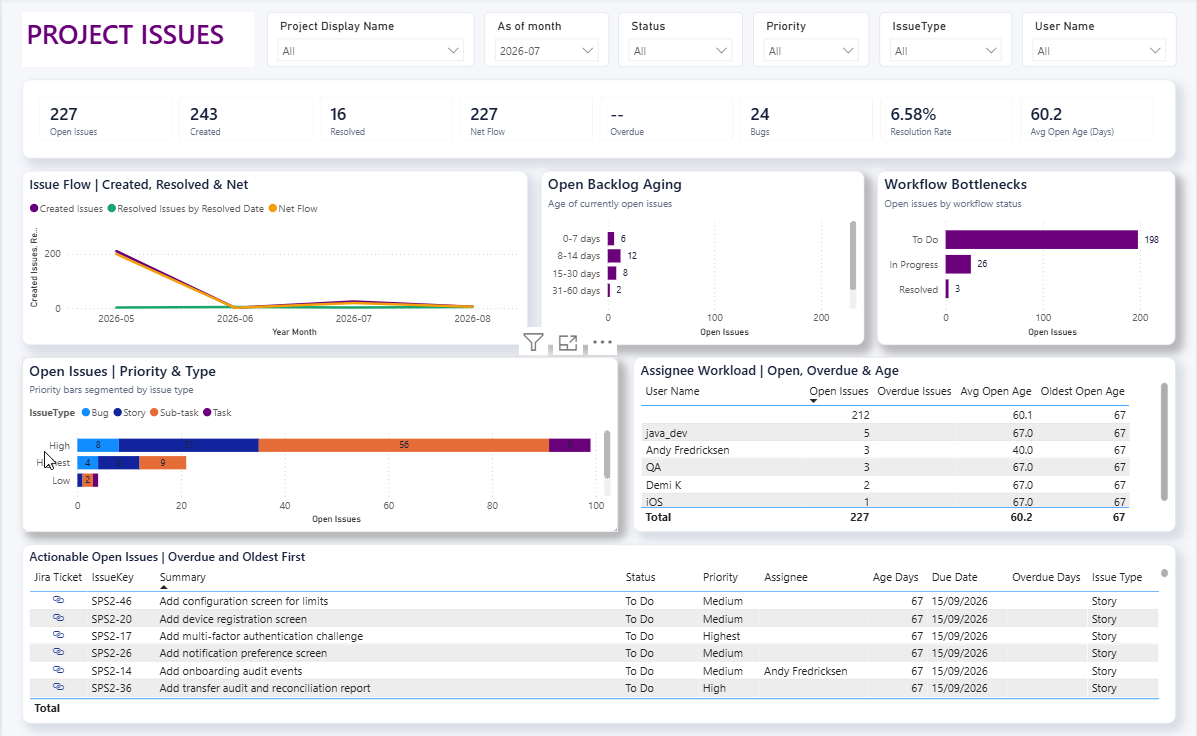
04 / Project issues
Turn Jira activity into a practical action list.
Explore backlog age, workflow bottlenecks, priorities, issue types, and assignee workload. Then move straight to the open issues that need attention first.
Power BI, your way
Built to use. Built to change.
This is a Power BI template, not a locked report. Use the included pages as they are, adapt them to your delivery process, or create entirely new reports from the underlying data model. Your Jira data stays useful beyond the views we designed.
02 / The Evaluation Edition
Ready to explore
Start with the finished report.
Turn a Jira CSV export into portfolio, project and issue-level delivery insight in Power BI—without building the reporting layer from scratch.
01Explore the sampleOpen the included PBIX and see the complete report before configuring anything.
02Import your Jira CSVExport all fields from Jira search, select the local CSV path and refresh.
03Adapt your viewEdit mappings, measures and report pages to fit your delivery language.
Power BI DesktopLocal CSV refreshIssues onlySample PBIX includedNo Jira write-back
Inside the package
Everything needed for a real evaluation.
Reusable Power BI Evaluation template
Ready-to-view synthetic sample report
Jira input template and sample CSV
Quick Start and CSV refresh guides
Data dictionary, licence and known limitations
Support and issue-reporting instructions
Before you begin
What you need.
Power BI Desktop with PBIT support
Permission to analyse the Jira data you export
A Jira issue CSV export containing all fields
A local folder Power BI can access
The Evaluation loads Jira issues only. Worklogs are not included.
Clear boundaries
Designed to test fit.
30-day internal evaluation licence
Manual local CSV refresh
Jira custom fields may need mapping changes
Very large exports may suit API Connected better
No guaranteed support or service-level commitment
Local by design
Your Jira CSV stays on your machine.
The Evaluation reads the local file path you provide to Power BI and does not write back to Jira. Never email passwords, credentials, confidential Jira data or an unredacted Jira export.
Yes. Open the included sample PBIX first. Its synthetic data lets you review the finished report before preparing your own export.
Does this change anything in Jira?
No. The Evaluation reads the CSV you export and does not write back to Jira.
Can I use my own project names and reporting categories?
Yes. Project mappings and report views are designed to be adapted in Power BI.
Is this the API Connected version?
No. Evaluation uses a local CSV export. API Connected refreshes directly from Jira Cloud and is a separate product.
03 / API Connected
Built for repeated reporting
Skip the export. Refresh from Jira.
Connect Power BI directly to Jira Cloud, define the dataset with JQL, and refresh the same portfolio, project and issue reporting experience whenever the conversation needs current data.
01Set the Jira scopeEnter the Jira Cloud root URL and the JQL that defines the projects and issue history to retrieve.
02Authenticate securelyUse Basic Web credentials with the Atlassian account email and its API token.
03Refresh directlyLoad paginated Jira REST API v3 issue data into the editable Power BI model.
Jira Cloud REST API v3JQL-controlled scopeDirect refreshIssues onlyEditable Power BI model
Inside the package
The connected reporting foundation.
Reusable API Connected Power BI template
Quick Start and authentication guide
Project mapping guidance
Data dictionary
API Connected licence and known limitations
Support contact and request template
Before you begin
What you need.
Power BI Desktop
A Jira Cloud site
Permission to browse every project selected by the JQL
An Atlassian API token for the connected account
Your Jira root URL and an initial JQL query
Clear boundaries
Designed for Jira issue reporting.
Jira Cloud issues only; Worklogs are not included
Large JQL scopes and Jira API limits can slow refresh
Custom fields may require mapping extensions
Power BI Service refresh needs separate configuration
No guaranteed issue-count or total-refresh-time limit
Credentials stay separate
Your API token is not stored in the template.
Power BI manages Jira credentials separately on each machine. Delivery Intelligence Lab never needs your token, password, Power BI credentials or confidential Jira data—and you should never send them by email.
Choose Basic authentication in Power BI, enter the Atlassian account email as the username and use its API token as the password.
Which Jira projects are loaded?
The initial JQL defines the dataset. The connected account must have permission to browse every project selected by that query.
Does the template contain my credentials?
No. Power BI stores credentials separately from the PBIT. API tokens and customer data are not included in the product package.
Can it refresh in Power BI Service?
Power BI Service refresh requires separately configured credentials and a gateway where applicable.
04 / Choose your edition
Start where your team is.
Both editions use the same editable reporting model and real report views. The difference is how Jira issue data reaches Power BI and how often you need to refresh it.
Evaluation · €69
Validate the fit with a local CSV.
Best when you want to explore the complete report, test your own authorised Jira export and adapt the model before committing to a connected workflow.
Evaluation and API Connected are the Jira Issues Analytics editions. Development now moves to Worklogs: adding time and effort context to the same delivery-intelligence approach.
In development · Worklogs EvaluationExplore effort with a local export.A sample-first Worklogs edition for validating time, effort and capacity reporting before connecting an operational refresh.
Planned after · Worklogs API ConnectedRefresh issue and worklog context.A connected edition for teams that need repeated Jira issue and worklog reporting in Power BI.
Issues are available. Worklogs are next.The roadmap now extends the product family with effort and capacity context rather than replacing the available Jira Issues editions.